

Equities: Primed for a shift?
Lance Humphrey, CFA & Michael Mack 16-Apr-2026

We imagine that many investors have been opening their brokerage statements and feeling pretty good (recent volatility not withstanding). When looking at the bigger picture, domestic equities, as measured by the S&P 500, delivered yet another solid year in 2025 and even printed new all-time highs earlier in the first quarter. But a closer look reveals some latent risks that are being overlooked—or ignored—by many. Is now the right time to consider shifting to more value-oriented strategies?
Concentration & Valuation
For starters, investors must acknowledge that any ETFs or mutual funds indexed to the S&P 500®1, which are typically used as a default core equity holding, have become overly concentrated. The mega-cap “Magnificent Seven” (comprised of Nvidia, Microsoft, Apple, Alphabet, Amazon, Meta and Tesla as of April 2026) represent roughly 30% of the cap-weighted S&P 500 index, and thus the performance of the index has become heavily influenced by just a few companies. Any shift in sentiment or slowing momentum in revenue and earnings growth in this narrow cohort could significantly hinder the future performance of such cap-weighted index funds.
Another risk is lofty valuations, which suggests that the market is priced for perfection. The forward P/E ratio of the S&P 500 was approximately 21x2, which is higher than its long-term average. By some measures, such as the S&P 500 Shiller CAPE Ratio3, the market has approached valuations similar to those seen prior to the 1929 market crash.
Given this backdrop, investors may want to consider if a portfolio of value-oriented equities—which typically trade at a lower multiple versus the growth-oriented stocks that now dominate the S&P 500—are at less risk for a severe pullback compared to the overall market.
Follow the FCF
For any investors considering a shift toward value strategies, we have some thoughts. In our view, the most powerful value-oriented metric is free cash flow (FCF), which is the remaining cash a company has after covering all expenses (and often used to grow the business, pay dividends, or pay down debt). Taking it one step further, FCF Yield is a financial ratio comparing free cash flow per share to its price per share. This helps illustrate if a company is generating attractive cash relative to its market value.
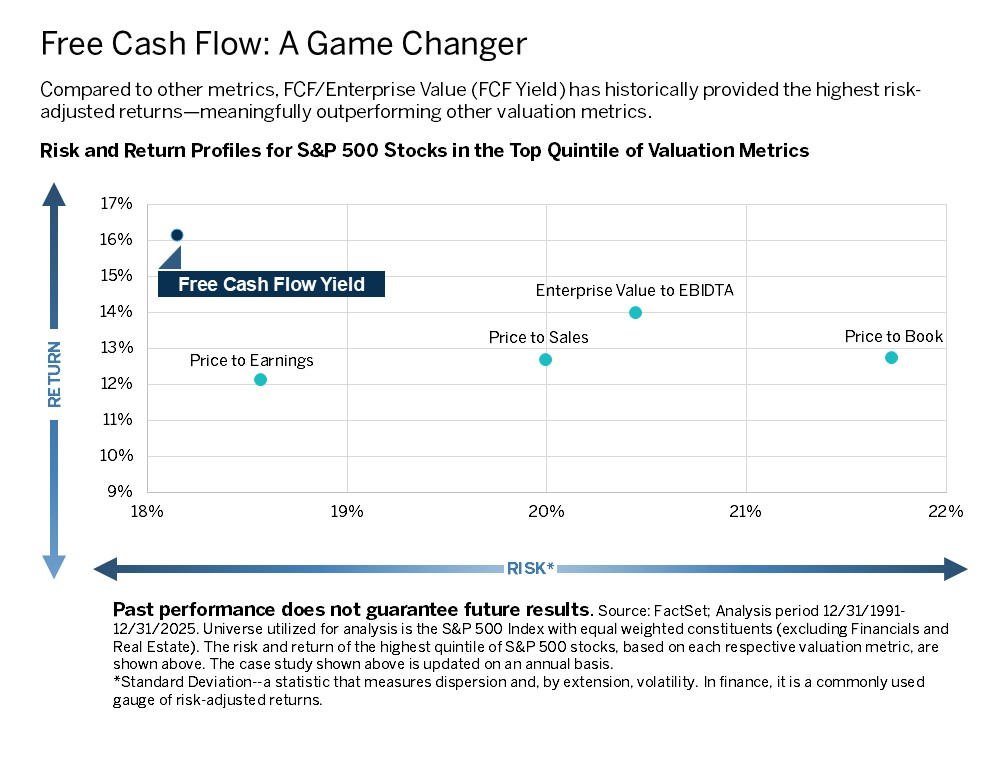
We believe free cash flow yield can be both a harbinger of long-term health and future potential performance (based on our research), as well as an indicator of risk-adjusted potential, as illustrated by the graph below. The key takeaway is that FCF yield has demonstrated better risk-adjusted returns when compared to other popular measures of valuation.
Moreover, we believe that using forward-looking free cash flow helps to avoid potential limitations associated with other popular value-oriented indexes that may rely on conventional metrics, such as Price-to-Book ratio. For example, Price-to-Book4 does not focus on profitability and does not account for intangible assets, which are especially important to the modern economy and the tech sector in particular.
Given the recent era whereby a select few mega-cap stocks have been dominating performance in the S&P 500, we think investors may want to consider more diversified and (not coincidentally) lower-valued strategies for their core equities. We think a systematic and unemotional approach based on FCF yield could be especially effective in building durable equities portfolios in today’s environment.
1 The S&P 500® Index is a market-capitalization-weighted index that measures the performance of the common stocks of 500 leading U.S. companies.
2 According to the team’s analysis using FactSet fiscal year (FY1) EPS estimates, as of March 2026.
3 The S&P 500 Shiller CAPE Ratio is one way to measure valuations on a historical basis. It’s sometimes referred to as the market’s Cyclically Adjusted Price-Earnings ratio and is calculated by dividing the current price of the S&P 500 by the 10-year moving average of its inflation-adjusted earnings.
4 Price-to-Book is the ratio of a stock's market value (price) to the value of total assets less total liabilities (book value).
